 Stocks tanked today, Wednesday May 18, 2022, as a US recession seems more likely. Overall, the S&P 500 sank 4.0% while the NASDAQ dove 4.7%.
93% of the stocks on the NYSE had downside volume on the day, the third such reading in the past month. This is an important factor, as market bottoms almost always have +90% downside volume days. What sucked the most is the market just went into a new rally yesterday. This huge down day might have killed the rally attempt.
Now, it seems the stock market will likely be in a recession (if its not already). That would mean lower profits for the S&P 500 and also a lower multiple, or P/E ratio. The S&P 500’s P/E ratio might go down from the current 17 to perhaps a low of 14 or 15 (source: Morgan Stanley). That’s around a 15% haircut from here. Profit estimates are for $231.61 in Earnings Per Share (EPS) for the index for 2022. So Let”s do the math:
- Equation: Profits x P/E = Price
- Currently: $231.61 x 16.94 = $3924
- Recession Estimate: $231.61 x 14.5 = $3358 (-14.4% from here)
What brought down the market was poor earnings reports from Walmart (WMT) yesterday and Target (TGT) today. The companies are dealing with higher freight and labor costs. Both companies had HUGE increases in inventory. Walmart had 32% growth in inventory levels, but sales only grew 2%. Target’s inventory soared 44% as revenue grew just 4%.
Target Stock Sank 25%
Target’s miss shocked Wall Street, and caused stocks to crater 25% to close at $162. TGT stock had its worst day since the Black Monday crash in 2987 (source: CNBC). Target’s COO said they had the “wrong inventory” as there was a slowdown in home, electronics, sporting goods, and apparel. Profit margins sank, and that will have to be the case for a while as inventory jumped 44%.
- Reported: $2.19 vs. $3.69 = -41%
- Estimate: $3.05 vs. $3.69 = -17%
- Revenue: +4%
- Same Store Sales: +3%
- Operating Margin margin fell from 9.9% a year ago to 5.3%.
- Inventory: $15.1 billion, up from $10.5 billion a year ago.
- Cash and Cash Equivalents: $1.1 billion, down from $7.8 billion a year ago.
Chart of the Day
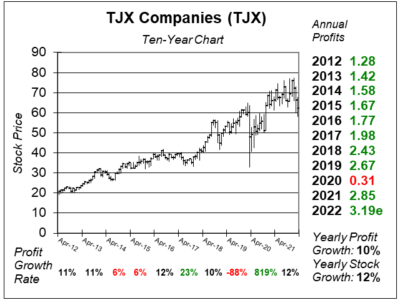 Our chart of the day is this ten-year chart of TJX (TJX) from last qtr. TJX reported profits today that beat the street:
- Reported: $0.68 vs. $0.44 = +55%
- Estimate: $0.60 vs. $0.44 = +36%
- Revenue: +4%
- Same Store Sales: +3%
TJX has been an All-Time stock market winner as its soared from $0.05 to $60 since 1980. It’s currently around a 12% grower that also pays a 1.7% dividend yield. Store expansion of 5% in addition to mid-single digit same store sales and a large stock buyback program make it possible for TJX to grow profits at a low double-digit rate (maybe 10% to 12% per year). The company earns A+ credit rating from Standard & Poor’s.