Stock Research
Institutional Research for Online Investors
Our stock research has been a staple for stockbrokers and financial advisers for more than a decade. Now available to online investors as well.
Our Focus is on Finding Stocks that Compound Over Time
At the School of Hard Stocks we do our own independent research and publish Research Reports on what we believe are the top stocks at the time.
David Sharek has published 1647 stock research reports on top growth stocks during the past five years (2015-2019) including Tesla (TSLA), ServiceNow (NOW), Trade Desk (TTD) and Paycom Software (PAYC).
The School of Hard Stocks Investment Process
Scour the Globe
We scour the world searching for stocks we think have the ability to compound in value over time.
Narrowed Focus
We narrow our focus on what we beleive are the top 75 to 100 stocks in the stock market at that time.
Update Stock Data
After a company reports quarterly earnings, we update fundamentals on each stock's spreadsheet.
Research Reports
David reads the earnings call, gathers relevant news, prepares charts and writes stock Research Reports.
Power Rankings
Stocks in our coverage are then ranked in our Growth Stocks and/or Value Stock Power Rankings.
Manage Portfolios
For our Money Management clients, we go into each account and place buy and/or sell trades.
Profit Growth Leads to Stock Growth
We believe profit growth leads to stock growth, and over long periods of time a stock’s annual growth rate is often similar to the company’s profit growth rate.
Our Research Reports are a great resource for finding tomorrow’s stock market winners today.
Paid Membership Benefits
For Online Investors and Financial Consultants Who Manage Stock Portfolios
Research
Reports
75 to 100 proprietary research reports on some of today’s best stocks.
Research Reports
Archives
More than 2000 research reports in our archives to research something you need to look back on.
Growth Stock
Power Rankings
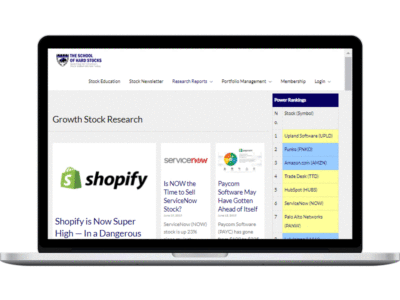
Sharek’s ranking of the top stocks in his managed Growth Stock Portfolio.
Conservative Stock
Power Rankings
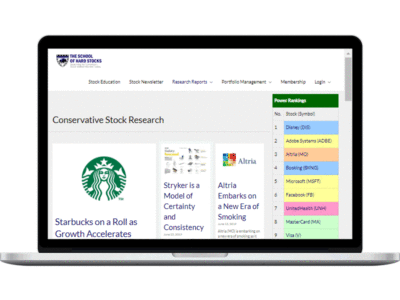
Sharek’s ranking of the best value stocks in his Conservative Growth Portfolio.
Research Reports
If you’re the type who likes to manage their own stock portfolio, you need to be aware of the top stocks, you can’t leave your portfolio on cruise control. You have to buy big winners towards the beginning of a run higher.
There are a slew fantastic new stocks, and you don’t have time to research each one. Now you can have a trusted source to rely on to tell you what stocks look good and what they may be worth.
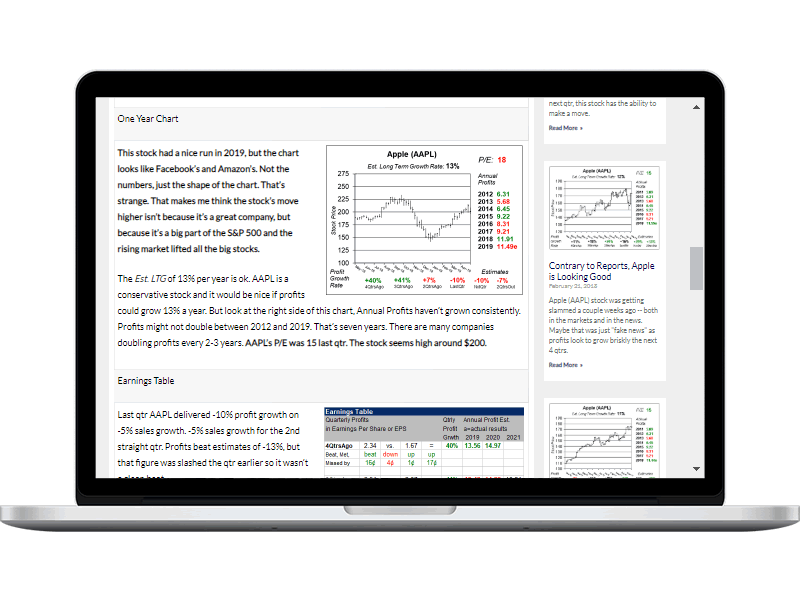
Research Reports are available with a Paid Membership. Here’s a free sample report, our latest on Apple (AAPL):
Research Report Archives
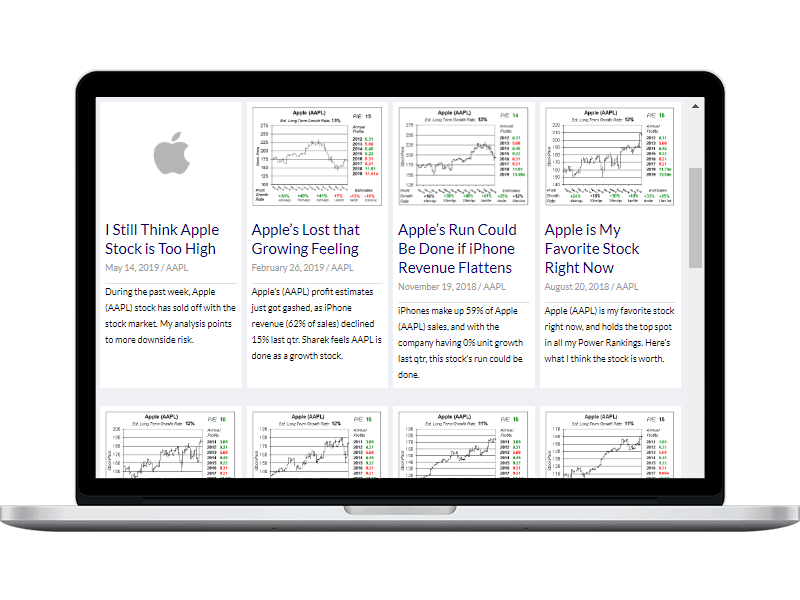
When researching stocks, you often look-back to past stock market winners to see what they looked like at before the big run, or see why a company had lower profits one year.
Subscribe to a Paid Membership. and gain access to our Research Report Library, which holds data going back ten years on some of the best stocks during the decade.
Here’s a free peek at our Apple (AAPL) research library:
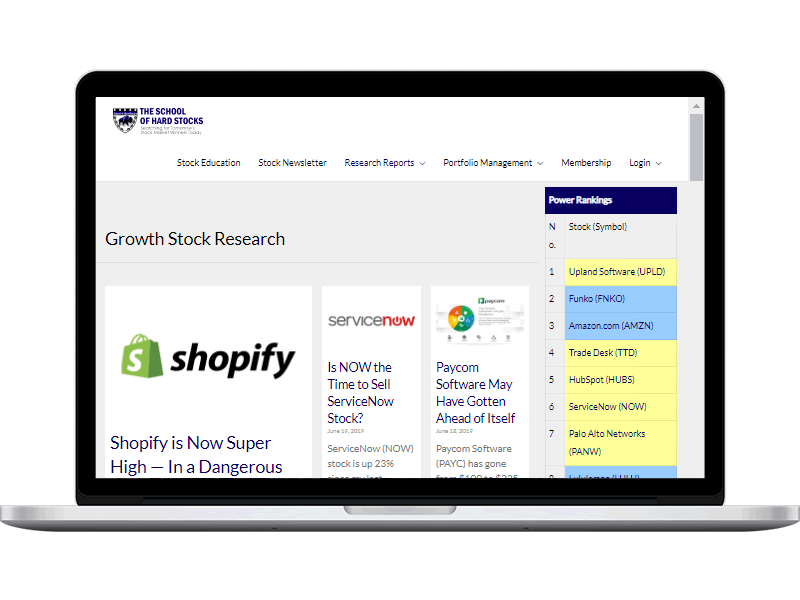
Growth Stock Power Rankings
Want to manage your own stock portfolio, but don’t have the time (or expertise) to do the work? We have portfolios you can mirror your own after.
Our Growth Stock Research includes in-depth research reports on top growth stocks in the market, including the Growth Portfolio Power Rankings. This is one of the best perks of a Paid Membership.
Value Stock Power Rankings
If you’re sick and tired of low-CD rates, and desire growth with safety, our Conservative Growth Portfolio holds some of the best Blue Chip stocks around.
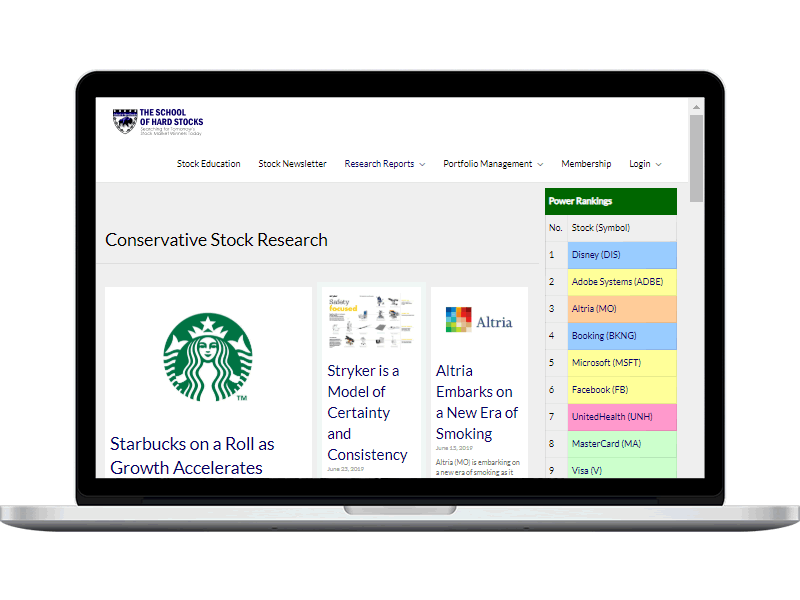
Our Conservative Stock Research includes in-depth research reports on Blue Chip stocks, some which pay dividends.
Here we show you our Conservative Growth Portfolio Power Rankings., which is David’s ranking of the top value stocks in the stock market.
Case Study
Apple (AAPL) 2009 Q4
A great way to learn how to identify great stocks is to go back and see what a big winner looked like before it made a dramatic gain.
Apple (AAPL) has been one of the best stocks during the last decade, so let’s go back ten years see what the stock looked like at the time.
AAPL had a 7-for-1 stock split since these charts were made in 2009 Q4, so I remade these and adjusted my comments to account for the split.
Sharek's Take
 This is the section in a Research Report where I give my overall take on the stock and discuss recent news as well as catalysts that could push profits higher.
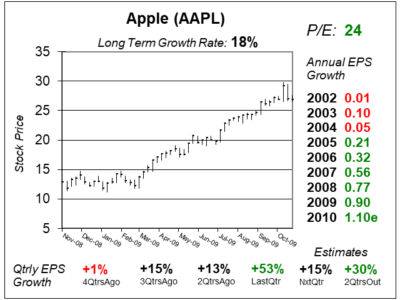
In this exercise, we will look back at my AAPL 2009 Q4 research report. In the original report I commented on each chart in the left column, with a supporting chart or table on the right. In this Case Study I removed my comments and replaced them with a tutorial on how to read our charts.
Remember these tables, charts and comments are from 2009. Charts and tables are adjusted for splits.
One Year Chart
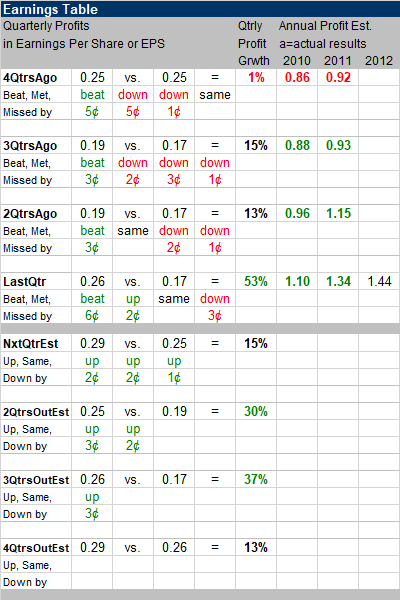
Earnings Table
Our Earnings Tables have a plethora of data. Fundamentals from each qtr are posted horizontally, with Annual Profit Estimates at that time on the right.
Annual Profit Estimates are in green if these increased from the previous qtr and red if they declined.
Profit estimates fluctuate before a qtr is announced. Each qtrly adjustment is noted in the Beat, Met, Missed by rows. So LastQtr AAPL beat estimates by 6 cents, and this estimate was upped by 2 cents three months earlier.
In the Qtrly Profit Growth column, profit growth of 20% or greater are in green, less than 10% are in red.
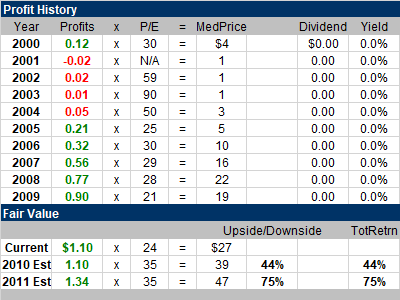
Fair Value
Profit History tables display a company’s annual profits (in EPS), median stock price and P/E the stock sold for. Dividend history is included on the far-right. Record profit years are in green, non-record years are in red.
Using past history and the future outlook, we estimate a Fair Value P/E for the stock. A rule of thumb is the P/E = the rate profits are growing at.
Bottom Line
Our ten-year charts show the monthly price data for the stock during the past decade, with profits along the right and the profit growth rate at the bottom.
Over the long-run (ten years) a stock’s growth is often similar to its profit growth (if the P/E remains consistent).
At the bottom of each Research Report we tell you if the stock is worthy for one of our portfolios, and if so where the stock ranks in that portfolio’s Power Rankings. Higher rated stocks are normally larger positions in portfolios.
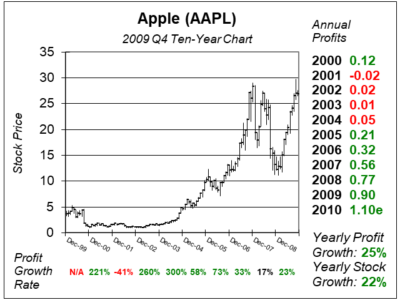
 During 2009 Q4 AAPL was $27 after-splits. The stock was $271 in my AAPL 2019 Q4 report, giving its investors a ten-fold gain in ten years (a ten-bagger) in addition to $16 in dividends.
Also, Apple was my #1 stock at this time, but I have nothing to brag about. I bought and sold the stock multiple times during the past decade, and didn’t deliver the gains I would have if I bought-and-held.
Wanna See Our Stock Research?
Here's a FREE Look:
Example Research Reports

Factset Research (FDS) Shows Strong Growth Despite Market Challenges
Factset Research (FDS) is a high quality stock that hardly ever sells at a discount. But with a P/E of 25, this stock is a good value.

Accenture’s (ACN) New Bookings Growth Signal Business is Getting Better
Accenture (ACN) has been growing slowly lately, with -1% sales growth last qtr. But bookings grew 22%, signaling better times ahead.

With a P/E of Just 22, Travel Site Booking (BKNG) Has Room to Move Higher
Booking (BKNG) — parent of Priceline, OpenTable and KAYAK — might finally get the respect it deserves, which is a P/E of 30.

MercadoLibre (MELI) Revenue Rises in Brazil & Mexico, Declines in Argentina
MercadoLibre (MELI) delivered a splendit quarter with 71% profit growth on 36% revenue growth as Brazil and Mexico lead the way.

Arm’s (ARM) AI Potential is Enormous, But So is the Stock’s Lofty Valuation
Arm’s (ARM) is an industry leader in building CPUs. Semiconductors are hot right now due to AI. But is this stock too high to buy?

Liquid Cooling AI Racks are the Next Opportunity for Supermicro Computer (SMCI)
Supermicro (SMCI) is excited about its new Direct Liquid Cooling (DLC) AI racks which can save 40% on datacenter energy costs.
About David Sharek
David Sharek is stock portfolio manager for Shareks Stock Portfolios and founder of The School of Hard Stocks.
David’s flagship Growth Stock Portfolio has returned 13% per year since inception vs. 9% in the S&P 500 (2003-2019). He‘s had four years of +40% returns in his 17 years as a portfolio manager.
Sharek is author of the book The School of Hard Stocks — How to Get Your Portfolio Back to Even, which can be found on Amazon.
Paid Membership Benefits
Here's What You Receive with a Paid Membership
Research
Reports

75 to 100 proprietary research reports on some of today’s best stocks.
Research Reports
Library

More than 2000 research reports in our archives.
Growth Stock
Power Rankings

Sharek’s ranking of the top growth stocks in the market
Conservative Stock
Power Rankings

Sharek’s ranking of the best value stocks in the market today.
Monthly Membership
if you manage your own portfolio(monthly subscription)
-
Research Reports
-
Research Report Library
-
Growth Stock Power Rankings
-
Value Stock Power Rankings
-
Money Management
Annual Membership
if you manage your own portfolio(annual subscription)
-
Research Reports
-
Research Report Library
-
Growth Stock Power Rankings
-
Value Stock Power Rankings
-
Money Management
Money Management
let us manage your stock portfolio(billed quarterly)
-
Research Reports
-
Research Report Library
-
Growth Stock Power Rankings
-
Value Stock Power Rankings
-
Money Management

