 The stock market climbed on Thursday as a revised upward first-quarter GDP eased some investors’ recession fears. In addition, weekly jobless claims dropped to its lowest level since May.
Overall, S&P 500 rose 0.5% to 4,396, while NASDAQ was flat at 13,591.
Tweet of the Day
$ZI Morgan Stanley says it's time to get back into ZI
– Early signs of stabilization in the software layoff environment suggest a trough in FY23 & opportunity to reaccelerate growth in FY24. With shares trading at 16x EV/FCF, relative to the software group avg of 32x, we see an…
— Kaushik (@BigBullCap) June 28, 2023
Chart of the Day
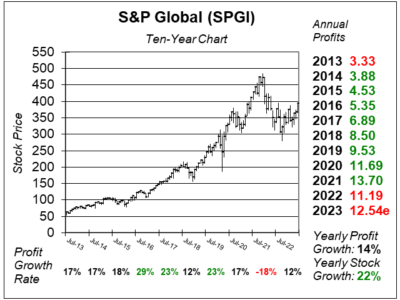
Here is the ten-year chart of S&P Global (SPGI) as of June 14, 2023, when the stock was at $393.
S&P Global has been providing financial information and analytics for more than 150 years. The company used to be a big player in book publishing, but has evolved to become more of a financial stock (with higher profit margins). Its operating segments include Market Intelligence (sector data), Ratings (credit ratings for bonds), Commodity Insights (info for energy/commodities markets), Mobility (automotive sector), Indices (DJIA & S&P 500), and Engineering solutions.
S&P Global’s operating results are improving, but the Ratings segment is still lagging. In 2019 and 2020, big companies issued a lot of debate (bonds) as interest rates were low. Global bond issuance was +18% in 2019, +22% in 2020, +7% in 2021, and -20% in 2022. In early 2023, bond issuance was good in January and February, then weak in March as lower confidence in the banking system caused the bond issuance market to decline. Higher interest rates caused Silicon Valley Bank, Signature Bank, and First Republic bank to fail in early 2023. However, SPGI Global Ratings shows billed issuance is expected to rise between 3% and 7% in 2023. So this could be the bottom for the Ratings segment.
This is a relatively safe stock that David Sharek, Founder of School of Hard Stocks, thinks can grow 15% a year.
SPGI is part of the Conservative Growth Portfolio.