 The S&P 500 just completed a head and shoulders chart pattern.
In simple terms, this chart has the look of three months, with a taller one in the middle.
Once the chart breaks below lows in the pattern, that’s considered a bearish signal that stocks are going lower.
Prior to today, we didn’t have a confirmation of this pattern. Now we do. Stocks look like they are going lower.
Overall, S&P 500 declined 1.5% to 4,274, while NASDAQ fell 1.6% to 13,064.
Tweet of the Day
Upon researching GitLab Inc. $GTLB accounting practices following KPMG's adverse opinion, I found this "DevSecOps" company has some of the most egregious security and customer data issues I have ever seen, all on the public internet.
I am short $GTLB.https://t.co/aPIS3hLbDv
— Lauren Balik (@laurenbalik) September 25, 2023
Chart of the Day
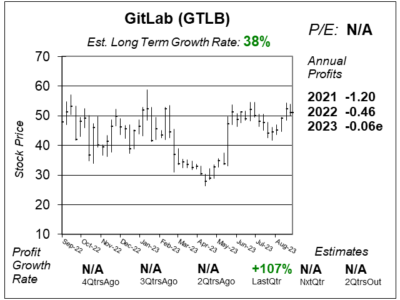 Here is the one-year chart of GitLab (GTLB) as of September 13, 2023, when the stock was at $51.
GitLab has a software platform that helps organizations develop software while including employees from different divisions within that company. GitLab operates under a DevSecOps Platform. It is a single end-to-end unified application that brings together development, operations, information technology, security, and business teams. It is for developers, security people, and operations staff.
GitLab delivered great results last quarter as the company posted a profit for the first time as a public company as revenue climbed a solid 38%. Still, revenue growth continues to slow. Since David Sharek started reporting GTLB in Q2 of 2022, revenue growth has gone down from 75% to 74%, 69%, 58%, 45%, and now 38%. Overall, he was extremely impressed with this quarter. But a short-sellers report has given me pause.
GTLB is on the radar for the Growth Portfolio.