About The Author
David Sharek
David Sharek is stock portfolio manager at Shareks Stock Portfolios and the founder of The School of Hard Stocks.
Sharek's Growth Stock Portfolio has delivered its investors an average return of 18% per year since inception vs. the S&P 500's 10% during that time (2003-2020).
David's delivered five years of +40% returns in his 18 year career, including 106% during 2020.
David Sharek's book The School of Hard Stocks can be found on Amazon.com.


 S&P Global (SPGI) is flying high as people herd into the S&P 500. For more than 150 years S&P Global has been providing financial information and analytics. In 1860 Standard & Poor’s founder Henry Varnum Poor published History of Railroads and Canals in the United States which made public previously undisclosed financial statistics of railroads. Meanwhile during 1899-1909 James McGraw and John Hill started their own trade publishing companies, which were merged in 1917 following Hill’s death. McGraw-Hill went public in 1929 and in 1966 it acquired Standard & Poor’s, which had been publishing a version of the S&P 500 since the 1920s. In 1986 the company become the largest education publisher in the US, but in 2013 that all changed as the company sold off the entire educational division and bought back 18% of its company shares that year. Last year McGraw-Hill divested itself of J.D. Power, the Equity & Fund Research business, and changed its name to S&P Global to better describe the company’s focus on financials. SPGI now has has four divisions:
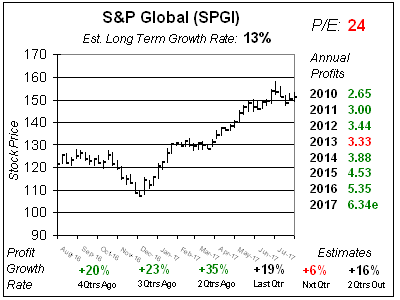
 Great looking one-year chart, outside the P/E of
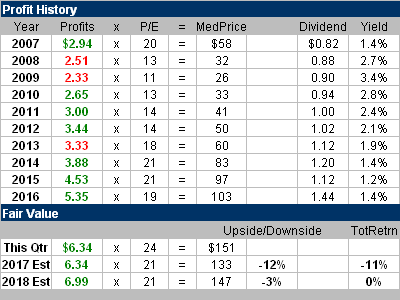
  I want to point out the P/E of 24 is higher than the median P/E the stock’s had in every year of the past decade. My Fair Value is 21x earnings or $133 a share.
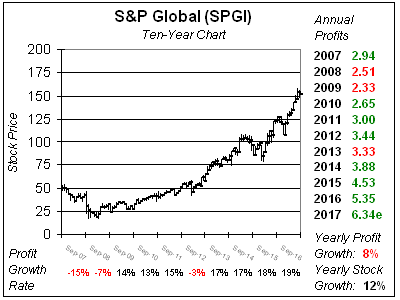
 S&P Global has been a great stock since March 2009 — which is one year after this bull market began. But note the stock’s angle has gotten higher the past two years even though profits have only grown in the teens. I love this stock for conservative investors, but feel it’s a tad high after a nice runup. I’m also cautious on the S&P 500 as I feel dumb investors have now climbed aboard. I’ll look to get SPGI if the stock dips.